pBuild 2.0 User Guide
3.2. Search results and database configuration
3.2.1. Search results configuration
1. Program description
pBuild is a tool that can compare several search engines’ results and combine them together. Currently it can process the results of pFind, SEQUEST and Mascot. The main functions of pBuild are as follows:
(1) Importing the engines’ data, including TXT files of pFind, DAT files of Mascot and OUT/OUTS/SQT file of SEQUEST.
(2) Comparing different engines’ results and combining them together.
(3) Plotting FDR curves.
(4) Exporting files including the list of spectra, peptides and proteins.
(5)
Highlighting
the parts of protein sequences which are identified.![]()
(6)
Plotting
the figures of mass deviation distribution.![]()
(7)
Plotting
the Venn diagrams of different engine’s results.![]()
The main interface of pBuild is shown in Fig 1.1.
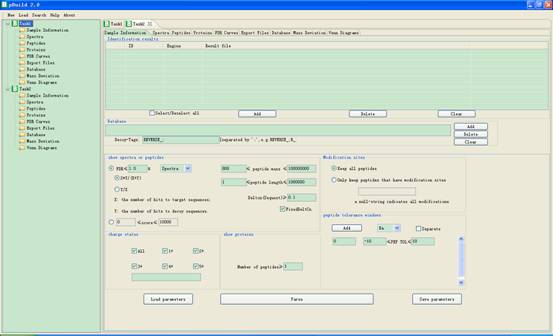
Fig 1.1 The interface of pBuild.
2. Installation
You need copy the related files/folder, including pBuild.exe, libResultParser.dll, builder.exe, configuration, plugins, p2 and put them into a proper directory. Then you can click the icon shown in Fig 2.1 to run it.

Fig 2.1 Icon of pBuild.exe.
![]() Notice: Java
2 Platform, Standard Edition (J2SE) required.
Notice: Java
2 Platform, Standard Edition (J2SE) required.
Hardware requirements:
l CPU: Pentium 233 or higher
l Memory: 512MB or higher recommended
l Hard Disk: at least 40GB
Operating Systems:
You can use any one of the following systems to run pBuild:
l Windows XP
l Windows 2000
l Windows Vista
l Windows 7
3. Parameter configuration
You can set the parameters in the Sample Information Interface (Fig 3.1):
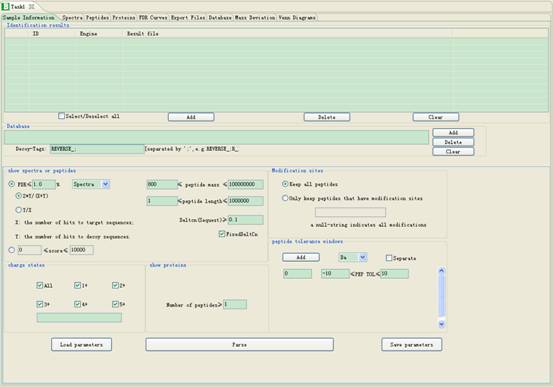
Fig 3.1 Parameter setting frame.
3.1. Filtering criteria
l FDR≤: Set the threshold of the false discovery rate. The default value is 1%.
l 2Y/(X+Y) or Y/X: Select 2Y/(X+Y) or Y/X as the FDR formula to use in pBuild, where X is the number of hits to target sequences, and Y is the number of hits to decoy sequences.
l Spectra/Peptides/Proteins: If “Spectra” is selected, all spectra take part in filtering. If “Peptides” is selected, the program will delete the same but redundant peptides which are identified by different spectra. If “Proteins” is selected, the program will delete the same but redundant proteins which are identified by different peptides.
l ≤Score≤: Set the upper and lower bounds of scores for different engines. Specifically, the score is the E-value of pFind, or the IonScore of Mascot or the XCorr of SEQUEST.
l ≤Peptide mass≤: Set the minimal and maximal values of peptide mass.
l ≤Peptide length≤: Set the minimal and maximal value of peptide length.
l DeltCn(Sequest)≤: Only used to set the minimal value of DeltCn in SEQUEST.
l FixedDeltCn: If it is checked, the program will use DeltCn value you set. Otherwise, the program will find the best value of DeltCn automatically.
l Charge: you can select the charge states targeted for analysis. Also you can add charge states you need in the button textbox. For example, you can add 7 and 8 charge by add “7,8” in the textbox which are separated by commas.
l Number of peptides≥: Set the minimal number of distinct identified peptides that a valid protein should contain.
l Modification sites: Filter identifications of specific modifications. One can use filter criteria such as ‘A
l Peptide tolerance windows: Set the minimal and maximal values of precursor mass based on the value in the left textbox (Fig 3.2), and the unit can be set as Da or ppm. You can add several precursor mass intervals by the button Add. Also you can check Separate for filtering several intervals one by one.
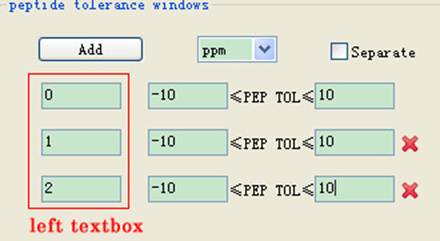
Fig 3.2 The frame of peptide tolerance windows.
3.2. Search results and database configuration
This part will show you how to import the results of database search engines and the database used, and to start an analysis task.
3.2.1. Search results configuration
You can add the results of different engines in the top-right form of the interface (Fig 3.3):
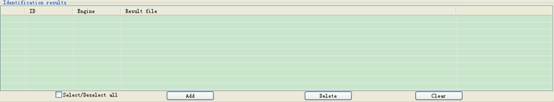
Fig 3.3 The frame of displaying loaded files of search results.
l You can click the Add button, and a dialog shown in Fig 3.4 will help you set detailed parameters:
n Engines list: the available engines supported by pBuild.
n Identification result file: the path of a result file.
n Browse all files in the folder: if checked, you can import several files just by selecting a folder.
n Group: if checked, pBuild will load them all and filter together; otherwise the files are loaded and filtered one by one separately.
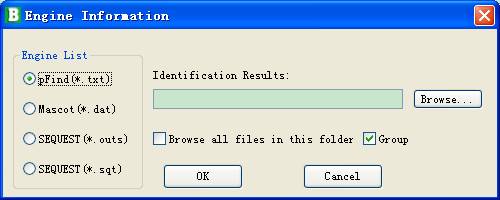
Fig 3.4 Loading files of database search result.
l By clicking the button Delete,you can delete the selected items in the data list (Fig 3.3).
l By clicking the button Clear,you can delete all items in the data list (Fig.3.3).
3.2.2. Database configuration
Fig.3.5 is shown as a part of Fig 3.3 used to add database information.
l Add: click it to choose a proper FASTA file and add it into the database list.
l Delete: click it to delete the selected items in the database list.
l Clear: click it to delete all items in the database list.
l Decoy-Tags: if the FASTA file includes decoy information, the decoy-tags used in this file should be filled here. For example, a protein whose accession number is YJR104C is reversed and the string “REVESED_” is appended to the original accession number, like REVERSED_YJR104C, then you may input the string “REVERSE_”, and pBuild can use this symbol to evaluate the search results in the engine data files.
![]()
Fig 3.5 You can add database in the interface.
4. Results presentation
After processing all data, you can view all data that kept by pBuild by changing the control button shown in Fig 4.1
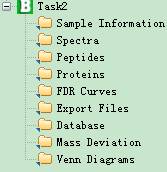
Fig 4.1 This is sub items of the task tree.
l Spectra: the interface showing identified spectra and their corresponding peptides.
l Peptides: the interface showing identified peptides and their corresponding spectra.
l Proteins: the interface showing protein information and peptide identifications of every protein.
l FDR Curves: the interface showing the FDR Curves.
l Export Files: the interface of exporting analysis result to files.
l Databases: the interface of highlighting the sequences of proteins which are identified.
l Mass Deviation: the interface of plotting figures of mass deviation distribution.
l Venn Diagrams: plotting Venn diagrams of different engine’s results.
4.1. Spectra
In this interface a spectrum list will appear in the main interface. When you click one item of it, a corresponding peptide list will be shown at the right part of the panel (Fig 4.2); you can select one or more items and click the right mouse key to copy them into the clipboard of the system.
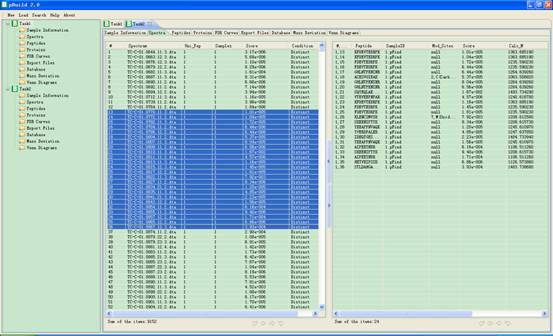
Fig 4.2 The interface of Spectra.
4.1.1. Column of Left Part
l #: serial number of the spectra.
l Spectrum: the scan number of each identified spectrum.
l Uni_pep: number of distinc peptides for this Spectrum.
l Samples: number of samples in which this Spectrum is identified.
l Score: score of the first peptide that matched this Spectrum
l Condition: the value is “Distinct” if this Spectrum is identified by only one sample, “Consistent” if all identification results of this spectrum is consistent, “Inconsistent” otherwise.
4.1.2. Column of Right Part
l #, Spec#: serial number of the peptide, serial number of the spectrum.
l Peptide: sequence of the first peptide that matched the spectrum of #, Spec#.
l SampleID: the sample to which the spectrum of #, Spec# belongs.
l Mod_Sites: modification sites of the Peptide.
l Score: score of the Peptide that matched spectrum of #, Spec#.
l Calc_M: mass of the Peptide.
l Delta_M: mass deviation of the Peptide that matched the spectrum of #, Spec#.
l ppm: relative mass deviation of the Peptide that matched the spectrum of #,Spec#.
l Proteins: Proteins which contain the Peptide.
4.2. Peptides
In this interface a peptide list will appear in the main interface. When you click one item of it, a corresponding spectrum list will be shown at the right part of the panel (Fig 4.3); you can select one or more items and click the right mouse key to copy them into the clipboard of the system.
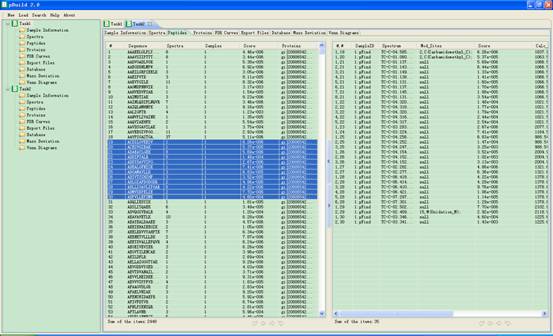
Fig 4.3 This is the interface of Peptides.
4.2.1. Column of Left Part
l #: serial number of the peptide.
l SQ: sequence of the peptide.
l Spectra: number of spectra which identified this peptide.
l Samples: numbers of samples the Spectra come from.
l Score: score of the first peptide matched this Spectrum.
l Proteins: Proteins which contain this peptide.
4.2.2. Column of Right Part
l #,pep#: serial number of the spectra, serial number of the peptide.
l SampleID: which sample the spectra are from.
l Spectra: the scan number of the spectra from which the peptide is derived.
l Mod_sites: modification sites and types of this peptide.
l Score: score of this peptide that matched the Spectra.
l Calc_M: mass of this peptide.
l Delta_M: mass deviation of this peptide matched the Spectra.
l ppm: relative mass deviation of this peptide matched the Spectra.
l Proteins: Proteins that contain this peptide.
4.3. Proteins
In this interface a proteins list will appear in the main interface. When you click one item of it, a corresponding spectrum list will be shown at the right part of the panel. (Fig 4.4) You can select one or more items and click the right key of the mouse to copy them into the clipboard of the system.
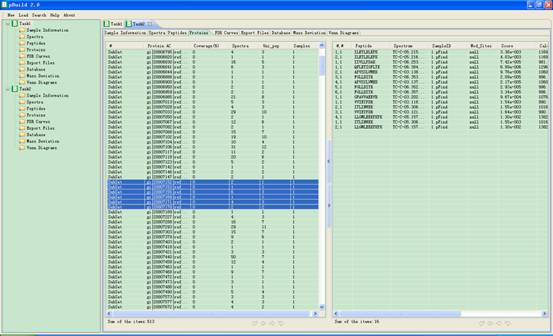
Fig 4.4 The interface of Proteins.
4.3.1. Column of Left Part
l #: serial number of the protein.
l Protein AC: accession string of the protein.
l Coverage (%): coverage of the protein by the identified peptides.
l Spectra: the scan of the spectra which the protein from.
l Uni_pep: number of distinc peptides for the protein.
l Samples: numbers of samples the Spectra come from.
4.3.2. Column of Right Part
l #, #: serial number of the spectra, serial number of the protein.
l Peptide: sequence of the peptide which is contained by this protein.
l Spectrum: the scan number of the spectra from which the Peptide is derived.
l SampleID: which Sample the Spectrum is from.
l Mod_sites: modification information of this Peptide.
l Score: score of this Peptide that matched the Spectrum.
l Calc_M: theoretically calculated mass of this Peptide.
l Delta_M: mass deviation of this Peptide matched the Spectrum.
l ppm: relative mass deviation of this Peptide that matched the Spectrum.
l Proteins: Proteins which contain this Peptide.
4.4. FDR Curves
In this interface a figure of several FDR curves of the search results will be displayed. You can change the charge state to view specific curves of spectra with different charges (Fig 4.5).
The method to calculate FDR is as follows:
(1) Construct a target-decoy sequence list, marking decoy sequences with a text flag in their annotation.
(2) Use a MS/MS search engine to interpret input MS/MS spectra using target-decoy sequence list.
(3) Sort all peptide hits by score, descending. Count how many target hits(T) and decoy hits(F) are greater than or equal to a given score.
(4) Calculate FDR using formula 2*F/(T+F) or F/T at the given score.
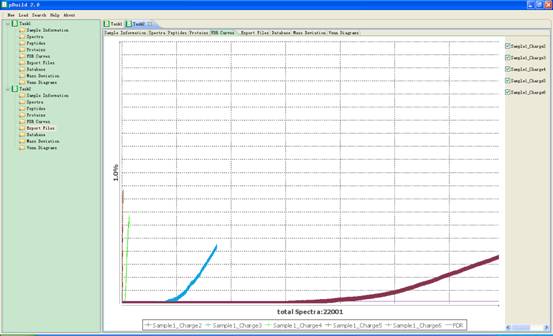
Fig 4.5 The interface of FDR Curves.
4.5. Export Files
In this interface you can select some supported output files and save to your disk (Fig 4.6).
l Export files to: the path to which you will save files. You can use Browse to specify the path.
l <File-Titile>: the name of the files you selected to save.
l Export: export the selected files to disk.
l pLabel: start pLabel (another software tool developed by pFind) to display spectrum annotation, with the file name provide by pBuild as input to pLabel.
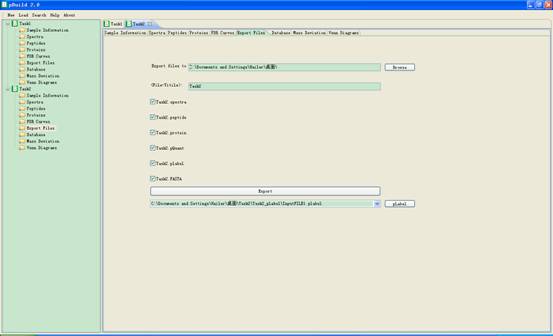
Fig 4.6 The interface of Export Files.
4.6. Databases
In this interface proteins information from databases will appear in the main interface. When you click one item of it, corresponding information will be shown at the right part of the panel (Fig 4.7). You can select one or more items and click the right key of the mouse key to copy them into the clipboard of the system.
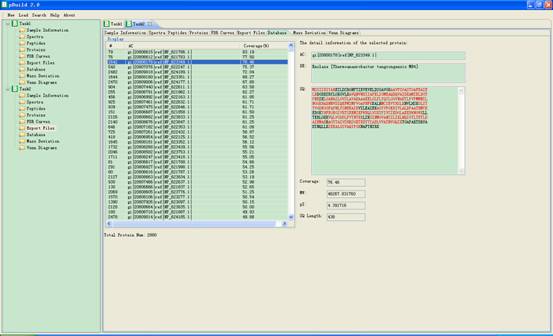
Fig 4.7 The interface of Database.
l AC: accession string of the protein.
l DE: description string of the protein.
l SQ: sequence of the protein. Red sequences are the identified peptides.
l Coverage: percentage of the protein coverage by the identified peptides.
l MW: molecular weight of the protein.
l pI: isoelectric point of the protein.
l Length: sequence length of the protein.
4.7. Mass Deviation
In this interface the precursor mass deviation distribution of spectra for each sample will appear in the main interface. A blue point indicates that the corresponding spectrum matched a peptide from the target database, and a red point for decoy database (Fig 4.8).
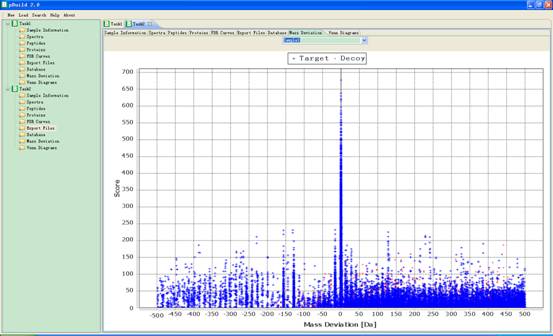
Fig 4.8 The interface of precursor mass deviation distribution.
4.8. Venn Diagrams
In this interface three Venn diagrams of spectra, peptides and proteins will appear in the main interface (Fig 4.9).
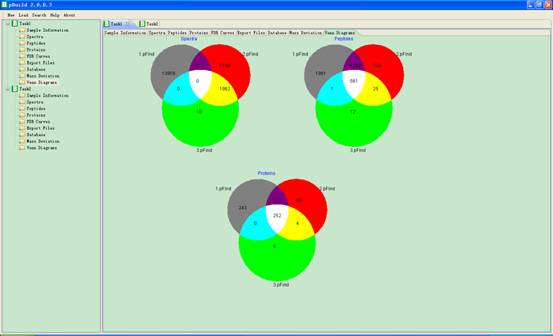
Fig 4.9 The interface of Venn Diagrams.
5. Tool-bar
Tool bar is in the up-left of the main interface (Fig 5.1):
l New: create a task.
l Load: load a task already in your computer and display the results.
l Search: query the information you want. You can also use Ctrl+F.
l About: some information about pBuild.
l Help: tell you how to use pBuild.
![]()
Fig 5.1 The interface of Tool bar.
6. Contact information
pBuild is being developed. In case of any problem, please contact us by:
E-mail: pfind@ict.ac.cn
Address: Institute of Computing Technology, Chinese Academy of Sciences.
No. 6, Kexueyuan South Road, Zhongguancun, Haidian District, Beijing 100190, P.R.China